













Colin Grabow
Since the Trump administration issued a Jones Act waiver in March for moving energy products and fertilizer, the data it has generated has not done the law’s defenders any favors. It shows substantial volumes moving during the suspension and new domestic commerce being spurred, which is exactly what Jones Act critics have long said would happen without it in place. What was once a largely theoretical argument about suppressed demand is increasingly based on demonstrable facts.
Unsurprisingly, groups that support the Jones Act have stepped up their campaign to kill the waiver.
Amid this campaign, the Transportation Institute (TI) — an advocacy organization that lists the Jones Act’s preservation as among its top objectives — last week made a startling claim. The waiver, it says, has “hardly added new capacity” to domestic shipping. Its clear message is that the waiver is something of a sideshow.
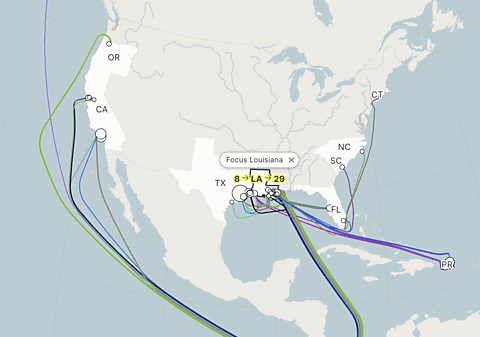
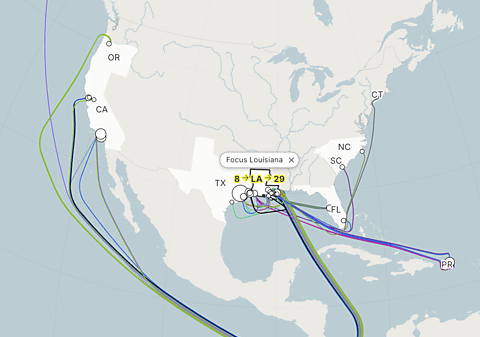
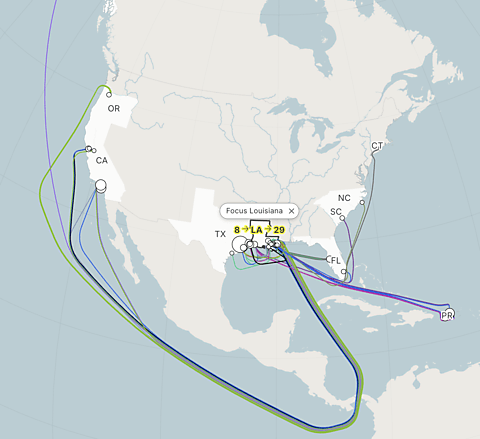
But that’s hard to square with the evidence. For example, government data shows that more oil and petroleum products have been moved by water under the waiver — in place for less than 120 days — between PADD 5 (the West Coast, Alaska, and Hawaii) and the rest of the United States than normally occurs in a year. The same is true of movements to Puerto Rico. Over 13 million barrels of oil and refined products have also moved from the Gulf Coast to the East Coast.
So how can TI plausibly claim that the waiver has been a relative non-factor? It turns out the answer is pretty simple: some of its key data points are inaccurate, and the errors are substantial.
Movements through the Panama Canal
According to TI’s analysis, 14 foreign-flagged ships comprising a collective 414,740 gross tons (a measure of a vessel’s total internal volume) transited the Panama Canal under the waiver between March 17 and June 24, either transporting cargoes from the Gulf and East Coasts to PADD 5 or in the reverse direction.
That’s incorrect. Data from the US Maritime Administration — the same source TI says it used — shows at least 23 voyages totaling 748,807 gross tons during this period. That’s over 60 percent more voyages than TI reported, and over 80 percent more tonnage.
Another eight voyages — totaling 237,623 gross tons — took place in the same window with cargo loaded and discharge ports identified, but without confirmed discharge dates. That’s more than double TI’s claimed tonnage.
Movements between the Gulf Coast and Puerto Rico
TI claims that just six voyages, totaling 180,739 gross tons, moved between the Gulf Coast and Puerto Rico over the same period. MARAD data shows 17 voyages with a collective gross tonnage of 517,076, which is nearly triple TI’s figures on both counts.
Movements between the Gulf Coast and East Coast
TI puts Gulf Coast-East Coast movements at seven ships totaling 222,162 gross tons. The real count, according to MARAD, is 25 voyages totaling over 1.1 million gross tons. That’s more than three and a half times as many voyages and roughly five times the tonnage.
Movements between the Gulf Coast and Florida
TI’s tally for the Gulf Coast-Florida route shows two ships totaling 35,846 gross tons. MARAD’s data tells a much different story, showing 13 voyages totaling over 319,000 gross tons. That’s six and a half times as many voyages, and nearly nine times the tonnage.
Laid out side by side, the pattern for the March 17-June 24 period across all four categories is unmistakable:
None of these are close calls or matters of interpretation. In each of these categories, the actual numbers of voyages and gross tonnage exceed those reported by TI, in some cases by several multiples. That is not a rounding error, but the difference between an accurate picture of the waiver’s effects and one that badly understates them. Notably, the errors all run in the same direction, with each showing the waiver voyages too low and never too high. The pattern of mistakes does not appear random.
The debate over the Jones Act has to start from a shared set of facts, and MARAD’s waiver reports — which TI says it used — are the most authoritative and accessible source on this question. That leaves the Transportation Institute in a difficult position. Correcting the record means adopting figures that undercut its own “hardly added capacity” argument, while leaving the current numbers standing means defending a data set that doesn’t match the public record it cites. Either way, the burden is on the organization to reconcile its analysis with established facts.